Pillar 01
Research Questions
Formulating inquiry parameters with conceptual rigor before touching syntax. Distinguishing investigative questions from mechanical indicator overlays.
Explore educational scan-design cases about universes, filters, timeframes, and what a result actually means.
Strict educational resource. Zero commercial trade signals, zero investment advice, zero performance promises. Independent study framework for quantitative screening syntax.
Quantitative screening fails when technical sliders are adjusted without prior inquiry. A rigorous screener translates qualitative market questions into verifiable criteria, bounded universes, and mandatory post-scan chart inspections.
Every scan must begin with an explicit structural hypothesis rather than software indicator knobs. What specific market phenomenon are you isolating? For example, whether an asset is consolidating near a multi-month range high or responding to post-announcement volume shifts. When the inquiry is ambiguous, output interpretation becomes impossible.
"If your question cannot be described in natural sentences without naming an indicator oscillator, the research question is not yet framed."
Filter equations operate on whatever data pool they receive. Applying a volume scan to the entire equity market produces drastically different distributions than evaluating large-cap index constituents or specific industrial sectors. Universe selection sets the statistical denominator for every filter.
The exact same criteria applied to a broad market index versus a cyclical semiconductor industry basket will output unrelated qualitative behaviors.
Market participants often describe abstract traits like "strength" or "consolidation". In this stage, qualitative notions are converted into observable, verifiable mathematical metrics such as ATR-normalized range spreads, rolling average volume multiples, or moving benchmark relationships.
Each criterion must evaluate a distinct market dimension: price dispersion, volume activity, or time persistence. Redundant metrics create false precision.
With clear questions, delimited universes, and defined criteria, conditions are translated into screener syntax using nested Boolean operators (AND, OR, NOT). Execution timeframes and aggregation periods are set to ensure indicators do not look across disparate time scales.
A scan filter is a mechanical search query, not a predictive engine. It returns instruments meeting specified mathematical thresholds at that exact second.
The screener output is a population of candidates, not an action directive. Analysts evaluate the result set distribution: if a scan returns 180 tickers, the filter criteria are too broad; if it returns zero, the conditions are over-constrained. Population size informs query calibration.
Candidate outputs illustrate market sector rotations and regime behavior across the chosen universe rather than individual security directives.
The final step can never be automated. Each instrument in the result set must be visually inspected against higher-timeframe charts, structural liquidity patterns, upcoming corporate events, and data anomalies such as illiquid gaps or bad print ticks.
Manual review eliminates data artifacts and discovers whether the filter logic actually isolated the scenario intended by the original research question.
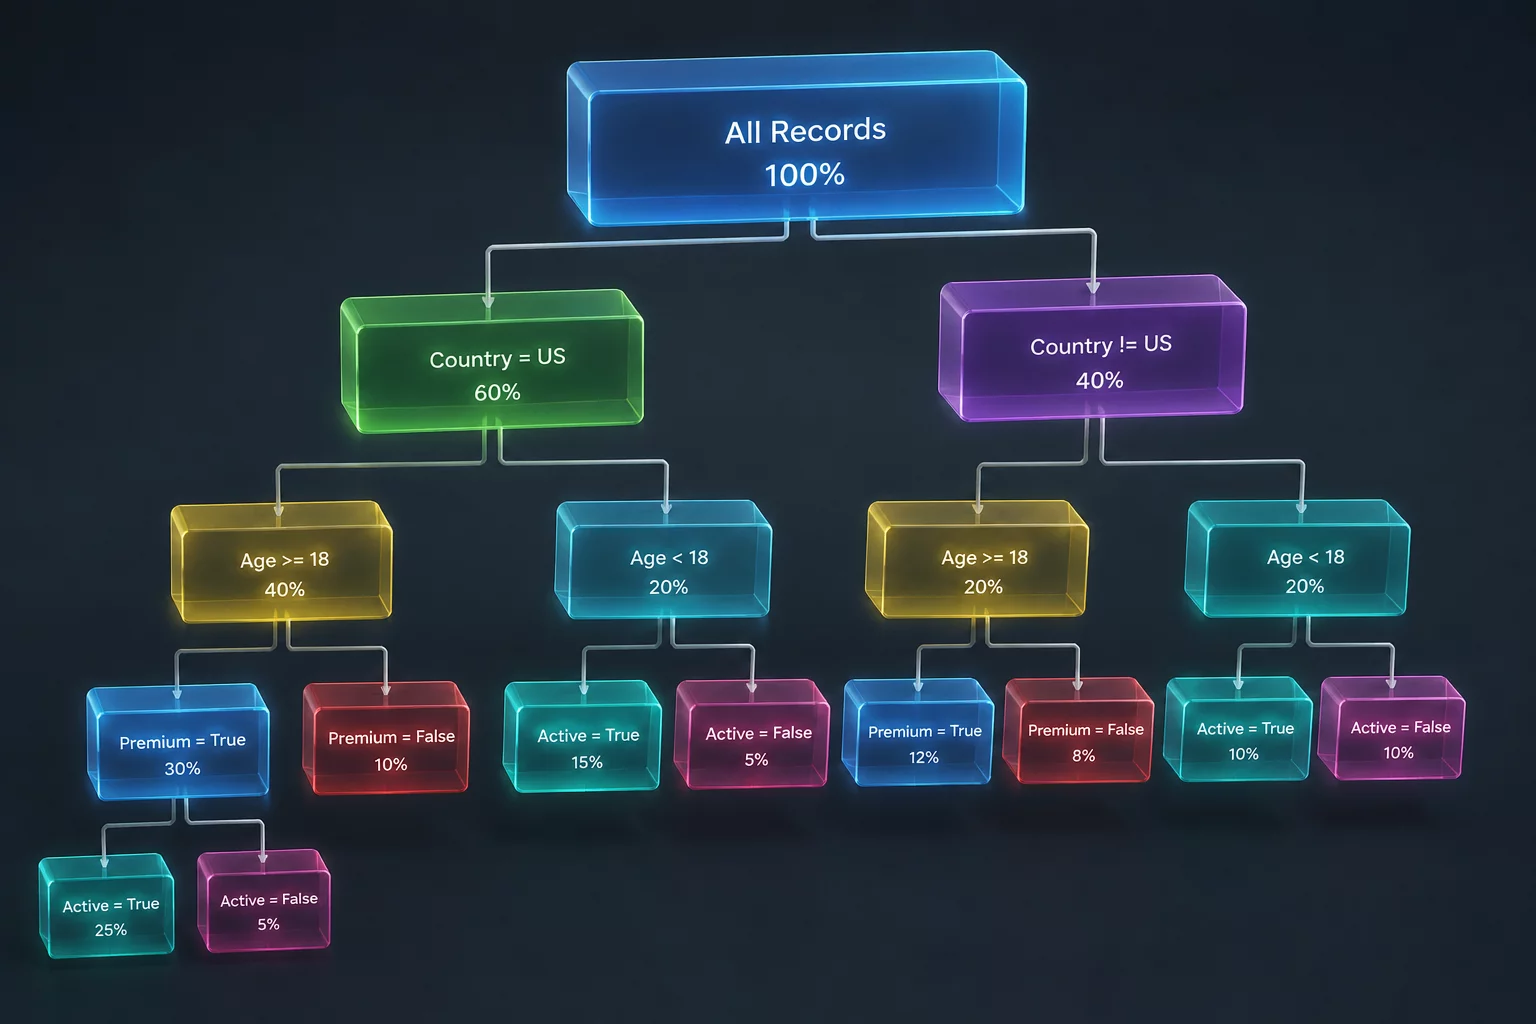
Deep dive into building logical parenthetical groups, chaining AND/OR criteria, and avoiding boolean leaks during multi-variable automated execution.

A structured inspection protocol for evaluating post-scan candidates, flagging illiquid wick anomalies, and refining query criteria.
Explore the sequential disciplines behind converting raw market questions into reproducible multi-condition filters and objective post-scan verifications.
Formulating inquiry parameters with conceptual rigor before touching syntax. Distinguishing investigative questions from mechanical indicator overlays.
Scoping boundary conditions across market capitalizations, volume hurdles, index constituents, and quantifiable observable data sets.
Constructing Boolean conditions, managing aggregation shifts, normalizing volatility ranges, and removing mathematical indicator redundancy.
Detailed case evaluations dissecting relative metric comparisons, sector versus broad market scope changes, and over-constrained screener funnels.
Establishing systematic post-scan verification checklists to filter out data artifacts, split anomalies, and feed insights back into query refinement.
Examine how theoretical inquiry translates into mechanical query architecture, parameter isolation, and disciplined post-scan analysis.
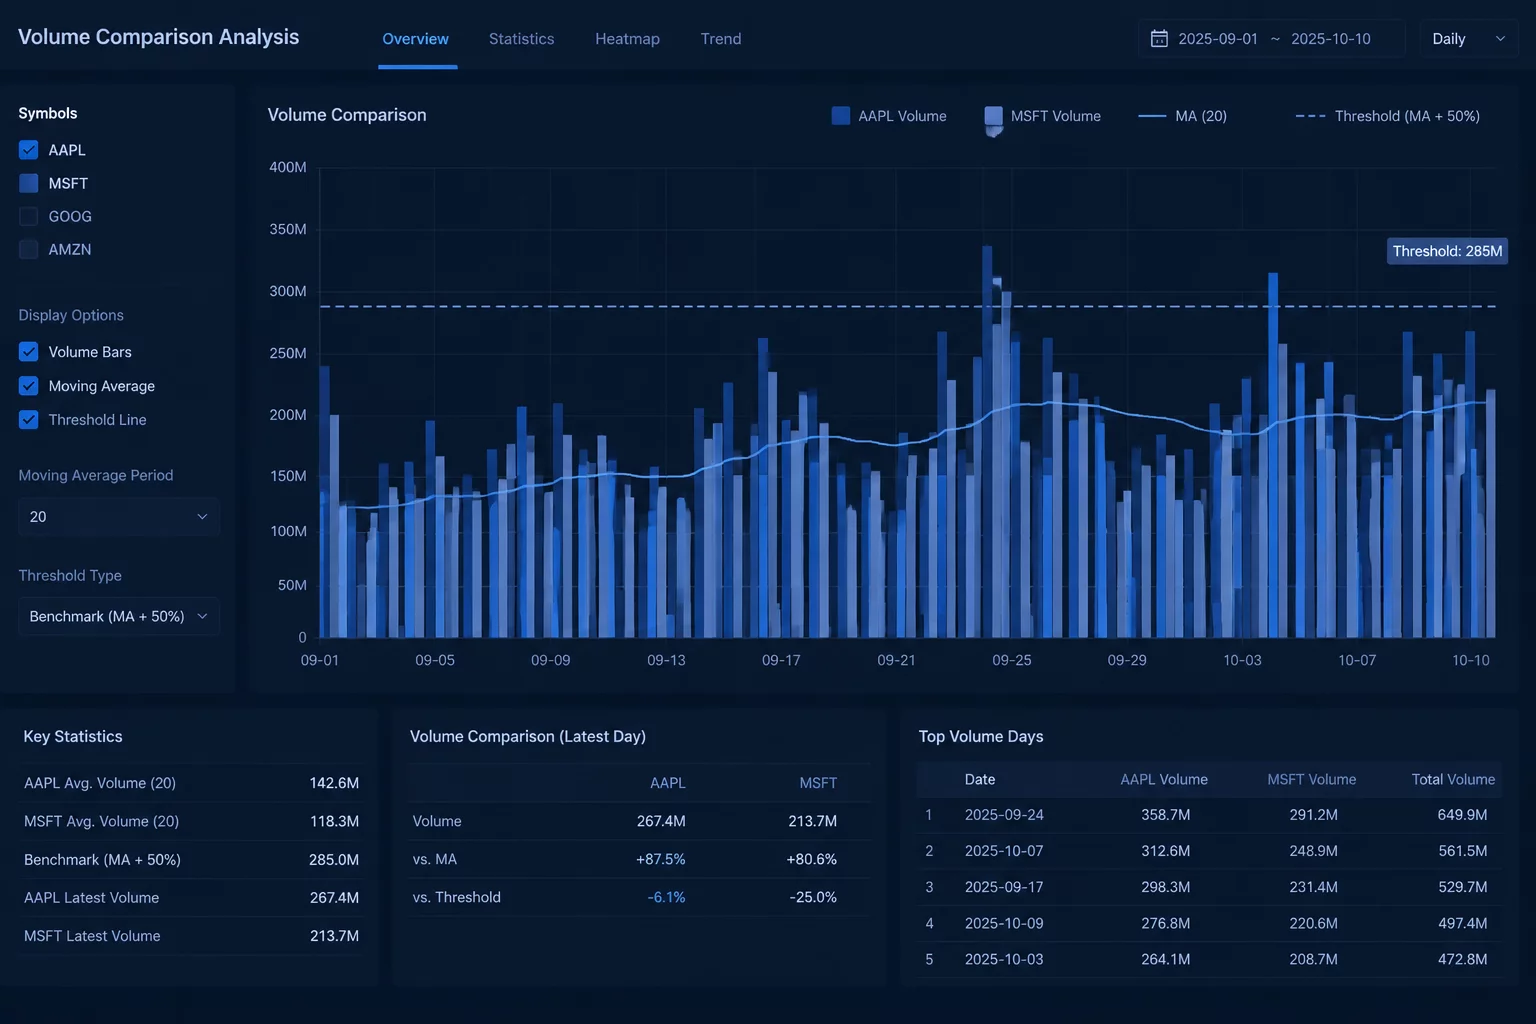 Volume Dynamics
Which symbols recorded unusually high completed-session volume compared with their own baseline?
Volume > SMA(Volume, 20) * 2.0 AND ATR(14) > SMA(ATR(14), 30) * 1.2
Normalizing absolute transaction metrics against rolling baseline medians identifies unusual recorded participation relative to the chosen baseline; it does not identify participant intentions.
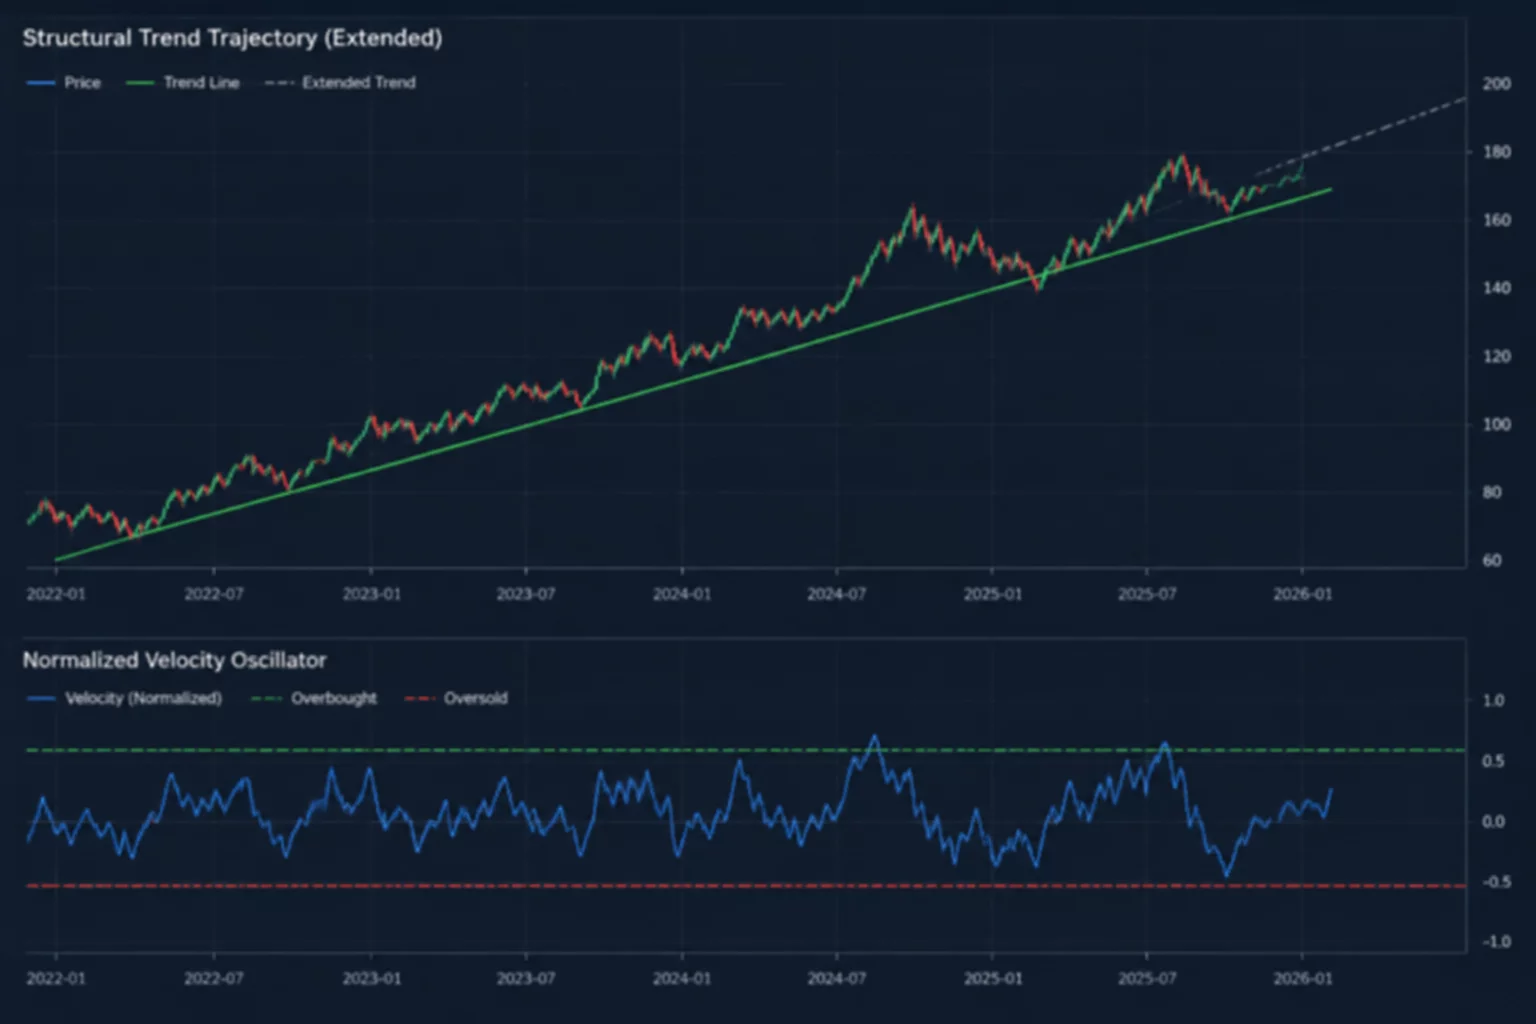 Multi-Condition
How does a longer-term trend condition overlap with a shorter-term momentum condition?
Close > SMA(200) [Slope > 0] AND RSI(14) Crosses Above 50 [Delta > 5]
Structural trend defines boundary state conditions while momentum metrics quantify rate of progress inside that designated regime.
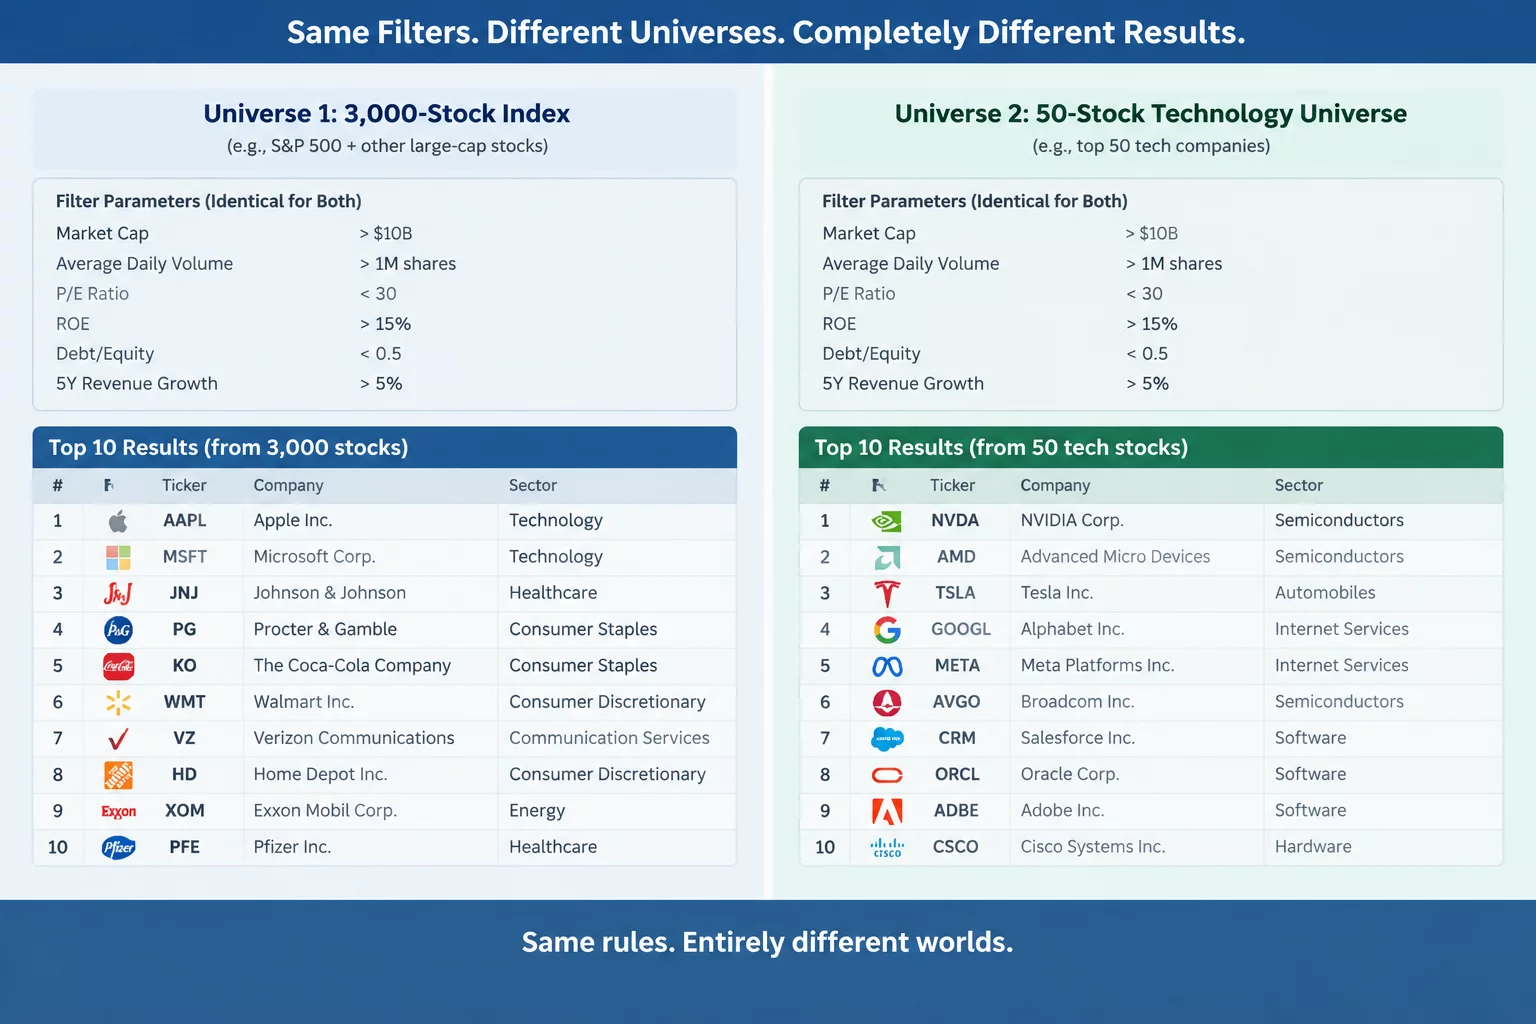 Universe Scoping
How does holding criteria constant while changing the eligible universe change the answer?
Universe = Broad Equities vs Sector ETF Components AND RS(60) > Index
Universe selection functions as an implicit primary filter; establishing peer-group baselines prevents unintended industry concentration.
 Query Calibration
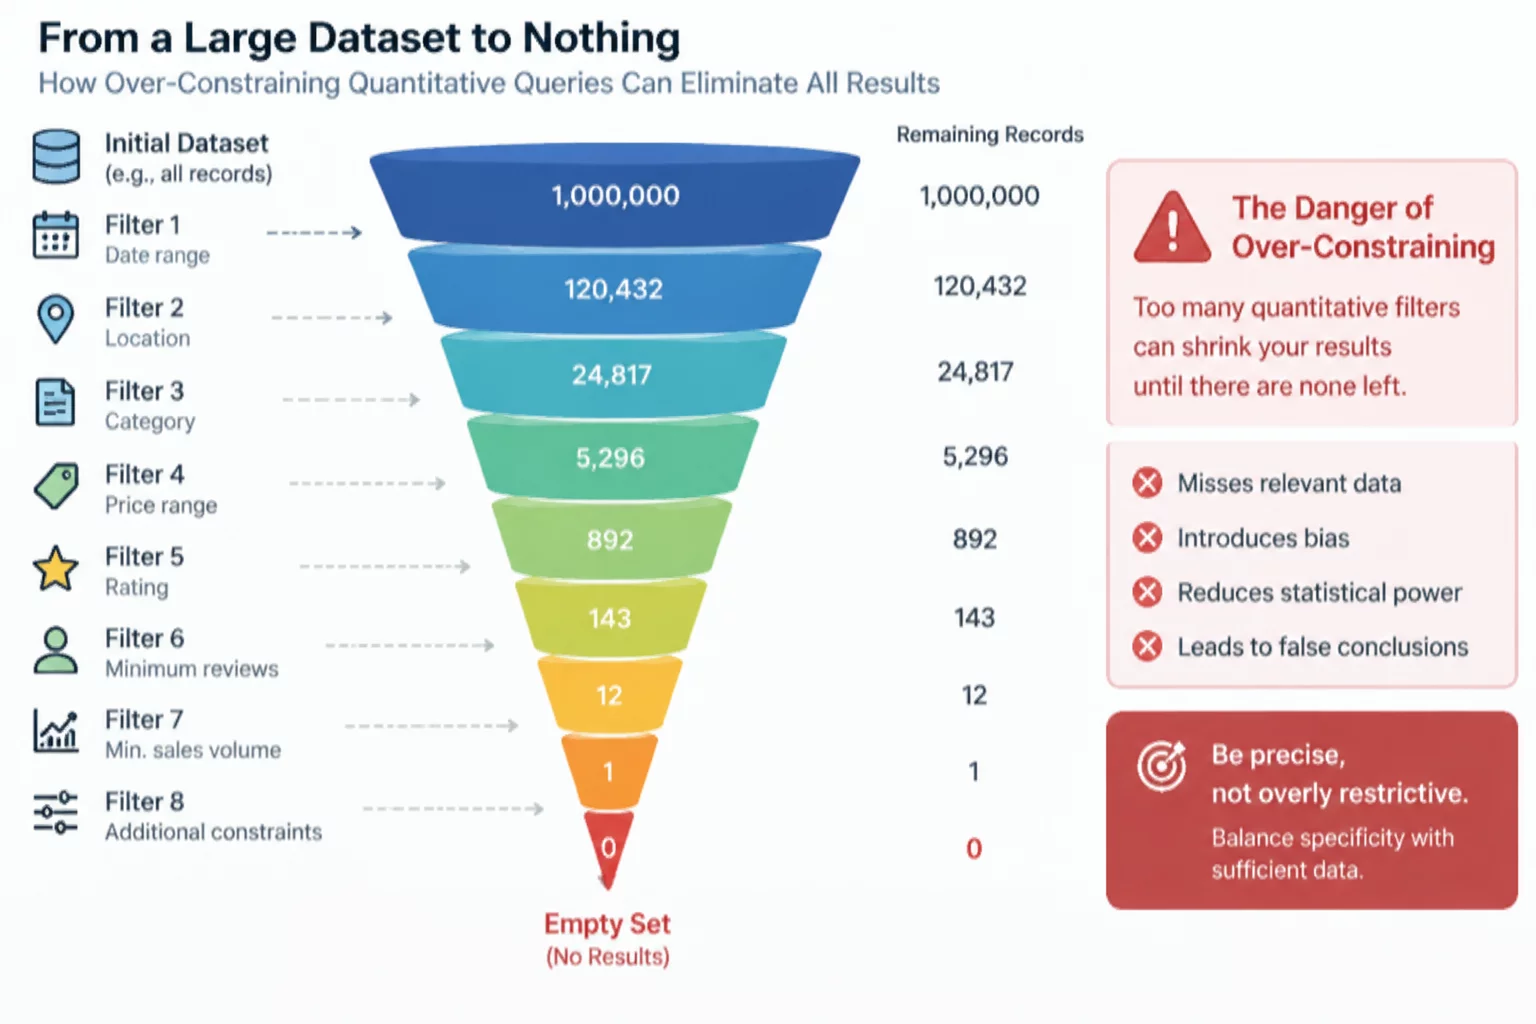
Which added conditions remove observations relevant to the original question?
Nesting 8 Simultaneous AND Conditions (MACD, Stochastic, Bollinger, ADX)
Redundancy creates illusory analytical rigor; de-nesting overlapping logic restores query interpretability and observable cohorts.
 Manual Review
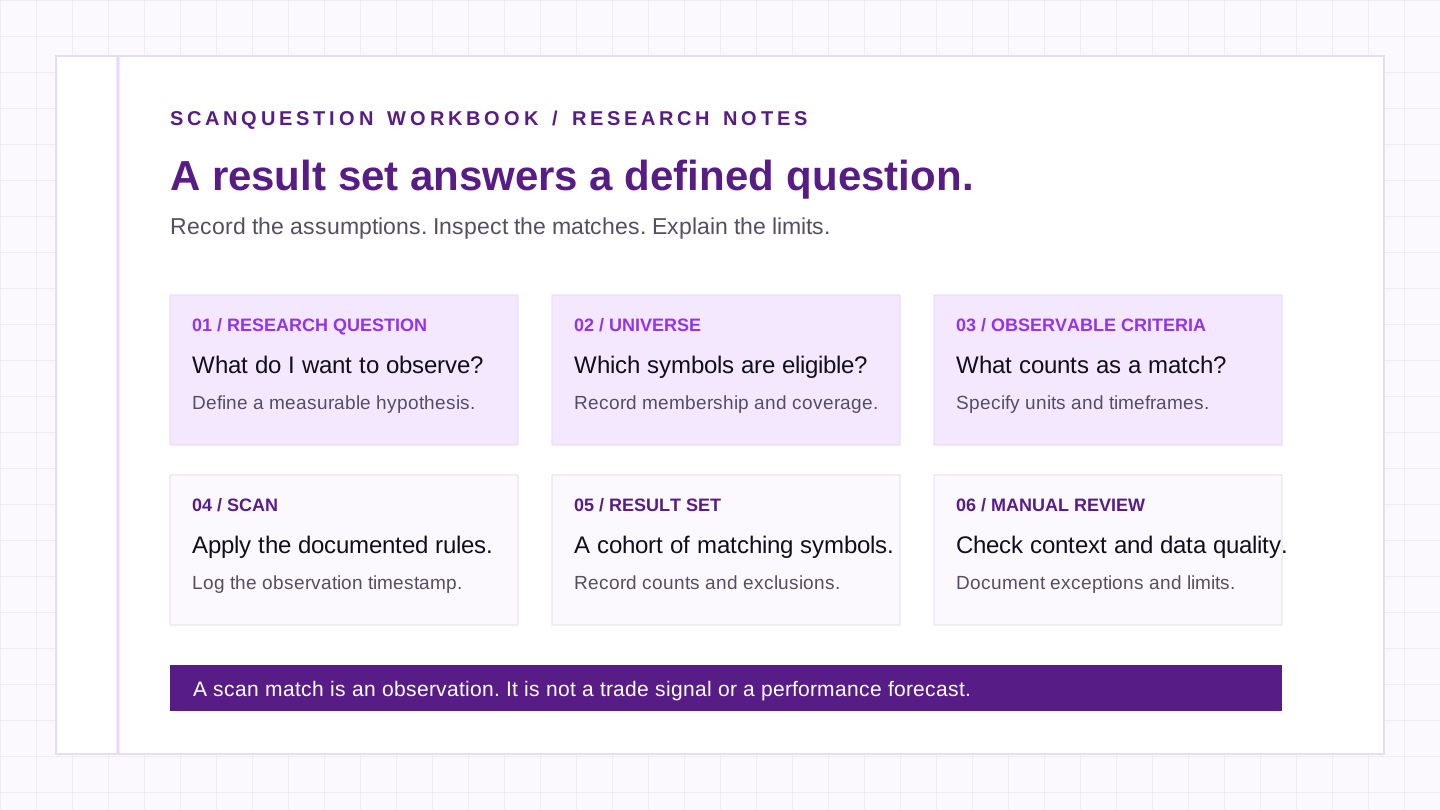
Which observations satisfy the recorded criteria, and which fail a data-quality check?
Fixed universe + documented conditions + recorded scan timestamp
Matching a condition establishes an observation. Review history, events, and data quality before interpreting the cohort.
 Different Questions
How does a reported-business cohort differ from a price-behavior cohort?
Compare Fundamental condition A, Study condition B, and their intersection
Quarterly business measures and daily price measures answer different questions. Hold the universe constant and inspect exclusions.
Explore how structured market inquiry contrasts with typical screener reliance across four vital operational dimensions of quantitative analysis.
Formulates a qualitative market hypothesis with clear conceptual boundaries before touching any screener filter parameters.
Randomly stacks indicator sliders and generic threshold values hoping an actionable cluster appears by coincidence.
Treats the raw result set strictly as a filtered observation pool requiring deep qualitative investigation and note-taking.
Assumes screener output constitutes a prescriptive action list, bypassing systematic contextual verification.
Deliberately scopes liquidity, index membership, and exchange tiers to prevent survivorship and size distortions.
Accepts default unexamined instrument lists, producing noisy samples polluted with illiquid or irregular instruments.
Applies a structured manual review checklist to audit false positives caused by calendar gaps, splits, or corporate actions.
Operates under the blind assumption that mechanical code criteria capture total market context automatically.
Synthesizing multi-variable screening criteria demands an understanding that financial metrics and price mechanics address fundamentally disparate research domains.
Why unadjusted price gaps, missing bar intervals, and ticker migrations routinely trigger mathematical filters without representing valid qualitative conditions.
A rigorous screener is not a random collection of filters. Discover how mathematical overlap, missing volume benchmarks, timeframe conflict, and unverified data compromise inquiry results.
Filtering by raw share counts or sudden volume spikes without establishing a sixty-day rolling median creates false positives in mega-cap tickers while completely bypassing liquid micro-caps undergoing institutional interest.
Volume > 2,000,000 AND Volume > Volume[1]
(Volume / Median(Volume, 60)) > 2.50
Layering RSI, Stochastic oscillators, and CCI inside the same scan query yields zero additional analytical power. These formulas measure velocity over similar lookbacks, simply multiplying execution latency and curve-fitting.
RSI(14) > 60 AND Stoch(14,3) > 80 AND CCI > 100
RSI(14) > 60 AND (ATR(14) / Close) > 0.035
Applying daily aggregation moving average criteria while interrogating intraday structural compression generates contradictory result sets. Unfinished daily bars rewrite metric thresholds during live market sessions.
Daily SMA(50) Cross AND 5m Range Compression
SMA(50, Daily)[1] > SMA(200, Daily)[1]
Treating algorithmic scan output as definitive evidence without manual verification introduces severe data artifacts, such as unadjusted stock splits, single-print anomalies, or erratic spreads, into candidate sets.
Auto-Export Raw Screener Results to Watchlist
Five-Point Visual Verification Protocol Checklist
A screener answers only what you specify. Avoid trial-and-error indicator stacking by structuring clear universe boundaries and verified observable criteria first.
Educational journals and financial curriculum auditors highlight ScanQuestion Workbook for decoupling analytical screening from prescriptive speculation, focusing squarely on testable logic and criteria hygiene.
“A refreshing departure from speculative trading lore. The workbook establishes rigorous mental boundaries between a research hypothesis and screener syntax.”
“The pedagogical framework demonstrates that screener outputs are not conclusions, but filtered candidate sets that mandate disciplined manual verification.”
“By insisting on universe delimitation before filter formulation, students grasp why identical parameters yield divergent results across sectors.”
 2026-09-09
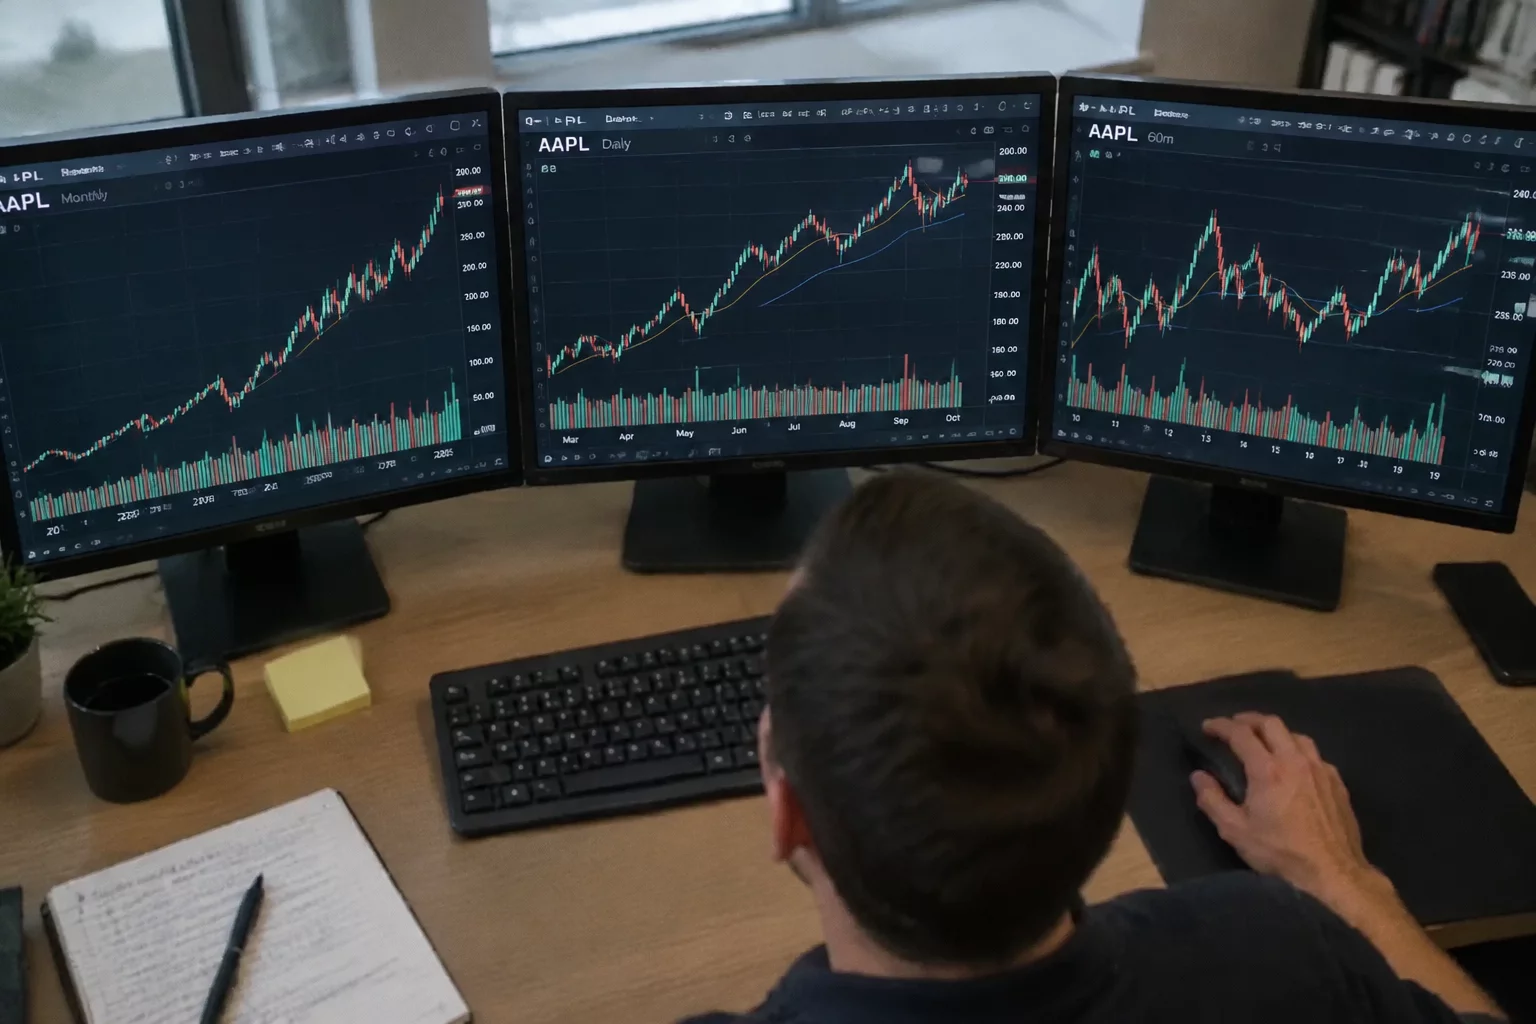
How multi-interval calculations alter screening sensitivity and why standard formulas require strict temporal alignment.
 2026-10-04
Constructing closed-loop feedback mechanisms to refine boundary logic following qualitative chart review.
Educational Screener Architecture
Stock Hacker supports Stock, Option, Fundamental, Study and Pattern filter categories. Save results as watchlists, then review the observations against your original question.
[Universe: named watchlist]
[Stock: Volume]
  Minimum: 750,000 shares
[Review]
Record observation time and session completenessA raw count is not a comparison with the symbol’s usual volume.
Editorial Disclaimer: ScanQuestion Workbook is an independent educational inquiry project providing filter architecture study materials. All software names, platform marks, and logos remain properties of their respective owners. Neither Charles Schwab & Co., Inc. nor thinkorswim endorse, review, or sponsor this pedagogical analysis.