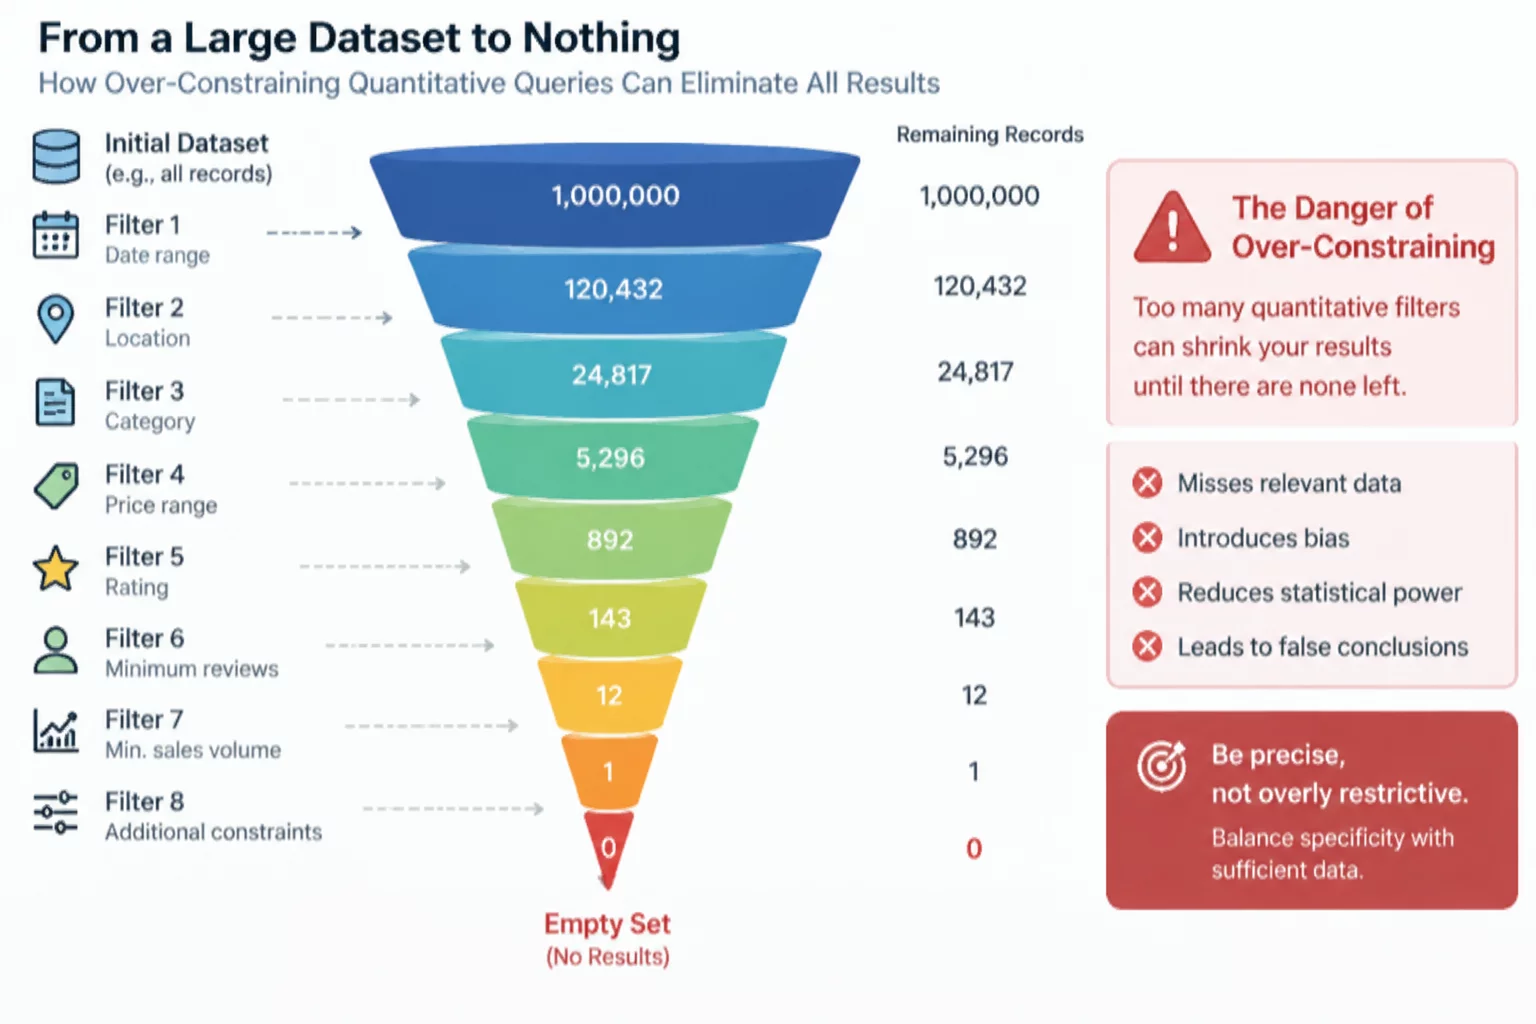
The Vanishing Population Paradox
When an analytical screener returns zero instruments—or worse, exactly one idiosyncratic outlier—the immediate instinct is often to adjust a single threshold. Yet this symptom usually signals a conceptual defect: the original inquiry has been suffocated under a pile of mutually restrictive conditions.
In quantitative research, curiosity begins with an open question: which equities exhibit sustained relative strength following an earnings announcement? However, as the query translates into code or platform filters, researchers frequently bolt on precautionary guards. A liquidity threshold is added, followed by an RSI oscillator ceiling, a moving average alignment rule, a volume surge multiplier, an ATR volatility limit, and a debt-to-equity ratio check.
Each individual filter appears prudent in isolation. Yet their joint intersection shrinks the sample space so aggressively that the surviving instruments no longer represent the phenomenon being studied. Instead, they represent statistical curiosities that happened to satisfy eight disparate mathematical boundaries at the exact same close of business.
Keep Core Hypotheses to Three Observable Bounds
Stacking redundant indicators does not improve precision; it simply creates a bespoke query fitted to recent historical quirks.
Deconstructing the Eight-Condition Breakdown
Consider a real workbook audit conducted on a mid-cap momentum screener. The analyst intended to study consolidation breakouts. Instead of isolating price range compression and volume expansion, the query incorporated eight simultaneous criteria across multiple timeframes. When applied to the Russell Midcap Index, the scan surfaced zero candidates across 78% of trading sessions and an unrepresentative single-stock outlier on the remainder.
- Starting Sample Universe
- 800 Mid-Cap Equities
- Active Filter Constraints
- 8 Compound Rules
- Zero-Result Session Rate
- 78.4% of Daily Runs
- Core Question Survivability
- 0% (Noise Dominated)
When the criteria were stripped back to the foundational research question—identifying a 20-day narrow price range followed by above-average turnover—the screener consistently surfaced 15 to 25 viable instruments per week. The manual review phase then easily filtered out unsuitable candidates without destroying the broad observational canvas.
“A screener should be a casting net that brings candidates to your examination desk, not a laser that claims to make your qualitative decisions for you.”
The Step-Back Method for Filter Pruning
Rescuing an over-fit screener demands deliberate subtraction rather than continuous parameter tweaking. Researchers must classify each condition into one of three distinct functional buckets: universe boundaries, core phenomenon detectors, or secondary qualitative preferences. Secondary preferences should almost always be evicted from the automated query and deferred to the manual review checklist.
By testing each filter in isolation against the universe, the researcher observes its marginal attrition rate. If adding an arbitrary oscillator cuts 92% of the previously valid candidates without logical alignment to the underlying hypothesis, that filter is acting as an accidental execution trigger rather than an exploratory lens.
Diagnostic Guardrails for Query Parsimony
The definitive goal of the ScanQuestion methodology is preserving the semantic link between the initial market inquiry and the resulting candidate pool. When a screener is kept lean, the researcher retains full cognitive clarity over why every single ticker qualified. False positives become obvious during manual review, and structural shifts in market breadth become immediately visible rather than being obscured by automated over-filtering.