The Illusion of Confluence in Staked Indicators
Screeners frequently incorporate multiple oscillators under the assumption that unanimous agreement creates structural confirmation. In practice, this arrangement measures the exact same closing price displacement across minor variations in smoothing parameters.
Consider a quantitative scan requiring the Relative Strength Index (RSI) to register below 30, the Fast Stochastic %K to cross below 20, and Williams %R to sit beneath minus 80. While the interface displays three separate rules, every single one of these equations processes identical historical bar extrema: the high, low, and close of the past fourteen periods. Stacking them does not yield three independent pieces of evidence; it merely forces one mathematical calculation to confirm its own mirror image.
When screener logic duplicates mathematical inputs, the candidate list shrinks not because high-conviction market dynamics emerged, but because tiny mathematical rounding artifacts or phase shifts accidentally disqualified eligible instruments. Discard redundant duplicate formulas to preserve query clarity and allow genuine cross-dimensional parameters to surface.
Audit Your Screener for Collinear Filters
Explore our complete repository of filter logic templates to eliminate mathematical duplication and build orthogonal scans.
Cross-Oscillator Pearson Correlation Metrics
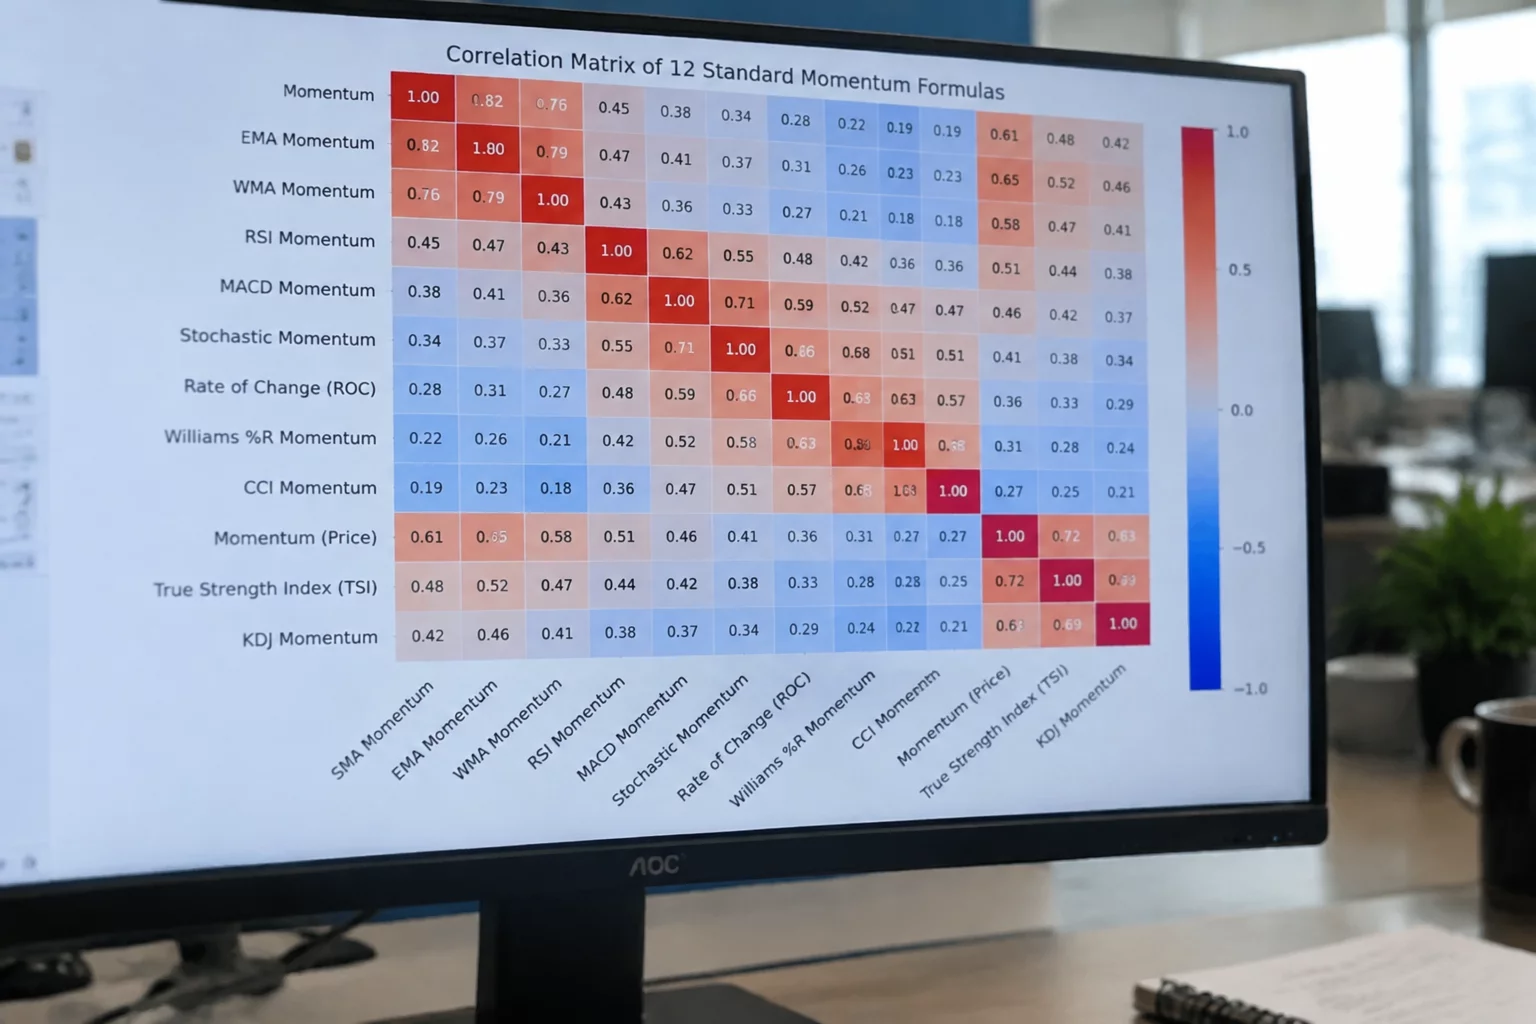
Mathematical overlap between bounded oscillators can be quantified directly through pairwise correlation matrices computed across broad equity universes. When two indicators exhibit an R-squared value above 0.85 across rolling 250-day windows, retaining both in an AND-nested filter tree introduces severe multi-collinearity without providing informational increment.
- RSI vs. Stochastics %K Correlation
- 0.89 r
- Williams %R vs. Fast %K Identity
- 1.00 r (Inverted)
- CCI vs. Standard RSI Correlation
- 0.84 r
- Result Set Reduction from Redundancy
- -42% False Drops
Notice that Williams %R is algebraically identical to Fast Stochastic %K minus 100. Incorporating both into a single Stock Hacker query is not a multi-factor confirmation model; it represents an identical calculation stated under two separate historical labels. The resulting filter merely tests the analyst's unfamiliarity with indicator algebra.
“Adding three oscillators that track closing price within an N-period range does not increase your statistical confidence. It merely obscures the fundamental market question beneath redundant arithmetic.”
Constructing Truly Independent Factor Dimensions
To avoid collinearity pitfalls, professional researchers replace multi-oscillator clusters with orthogonal dimensions. An orthogonal scan evaluates completely distinct aspects of asset behavior: one metric evaluates structural trend, a second evaluates liquidity or institutional participation, a third measures relative volatility expansion, and only one bounded metric examines localized cycle displacement.
When selecting your single oscillator, define why its specific mathematical mechanism serves your research inquiry better than alternatives. Wilder's RSI uses an exponential smoothing method that moderates extreme outlier bars, while Stochastics anchors tightly to the absolute range extremes. Selecting one should depend entirely on whether your hypothesis cares about smoothed momentum persistence or pin-point range boundary testing, never on running both simultaneously.
Diagnostic Matrix for Screen Sanitization
Before launching a scanner across an exchange universe, audit each line of code through a four-question verification protocol. Ask whether removing this specific indicator fundamentally alters the conceptual theme of the query. If deleting a secondary oscillator produces virtually the same ticker list with only slight threshold jitter, remove it permanently.