Applying an Identical Filter Set to Divergent Universes
Screeners do not evaluate market realities in an absolute vacuum. A screener executes a mathematical rule against the boundary conditions of an arbitrarily defined container of securities.
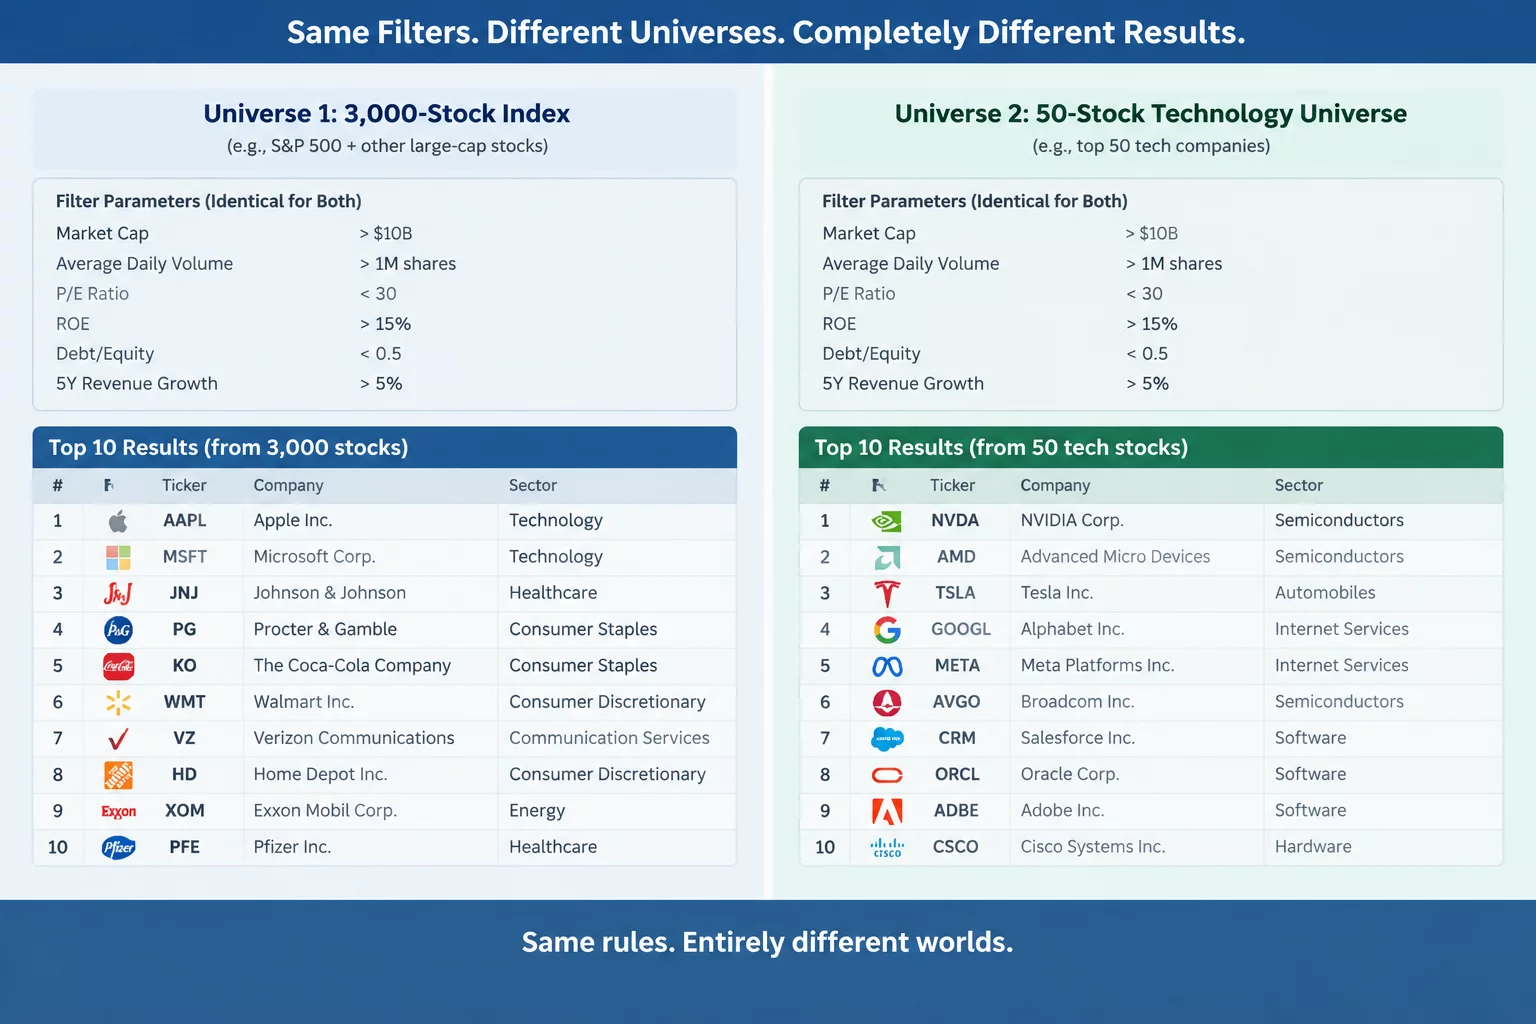
To examine how universe scope alters candidate discovery, we configured an identical three-parameter technical scan across two separate asset pools: a broad market composite of roughly 2,980 liquid US equities and a focused 30-member semiconductor sector index. The syntax required each candidate to meet three criteria on daily closes: a 14-period Relative Strength Index under 35, current trading volume exceeding 150% of the 50-day average, and a close stationed above the 200-day simple moving average.
The broad market execution returned twenty-four qualifying equities spanning healthcare, regional banking, and consumer defensive segments. The semiconductor universe execution returned precisely zero results. Without understanding boundary influence, an analyst might conclude that semiconductors lacked oversold candidates entirely, whereas the actual failure lay in expecting cyclical tech components to mimic consumer defensive recovery profiles.
Are Your Filters Calibrated to Industry Dispersion?
High-beta industry groups rarely share the statistical distributions of multi-sector composites. Learn how to define observable criteria tailored to universe boundaries.
Structural Dispersion and Metric Mismatch Across Industry Groups
Capitalization distributions, supply chain dependencies, and beta profiles differ radically between sectors. In a diversified composite of three thousand symbols, statistical dispersion ensures that at least a few uncorrelated companies will satisfy contradictory conditions simultaneously. In a concentrated thirty-stock industry basket, however, strong intra-sector correlation causes constituent equities to move in unison.
- Broad Composite Universe
- 2,984 Instruments
- Broad Candidate Matches
- 24 Symbols (0.80%)
- Sector Index Universe
- 30 Instruments
- Sector Candidate Matches
- 0 Symbols (0.00%)
During our test period, the semiconductor index was undergoing a sector-wide inventory recalibration. Every constituent had broken below its 200-day simple moving average. Demanding that an equity remain in a long-term primary uptrend while exhibiting severe short-term exhaustion produced an impossible mathematical gate for that universe, while broad market breadth masked the sector's synchronized reality.
“A screener cannot correct for a question asked in the wrong universe. The moment you switch from a broad composite to an industry cohort, absolute metric thresholds must yield to relative peer dispersion.”
Decoupling Research Inquiries from Arbitrary Universe Selections
Systematic screening requires explicit alignment between the original research question and the scope of the instrument pool. If the objective is locating relative oversold compression inside an industry under active institutional distribution, demanding a bullish 200-day trend line violates the premise of the inquiry.
In concentrated sector screening, relative ranking conditions frequently replace absolute scalar filters. Instead of demanding an unadjusted 150% volume spike, researchers often normalize daily volume against the median turnover of that specific industry cohort. That shift prevents illiquid sub-components from disappearing beneath large-cap benchmark thresholds.
Diagnostic Framework for Calibrating Universe Boundaries
Before interpreting any screener result list, evaluate your universe boundaries against three diagnostic rules: verify constituent correlation levels, verify whether metric ranges reflect the group's baseline volatility, and confirm that boundary filtering does not inadvertently eliminate the very market condition you set out to observe.