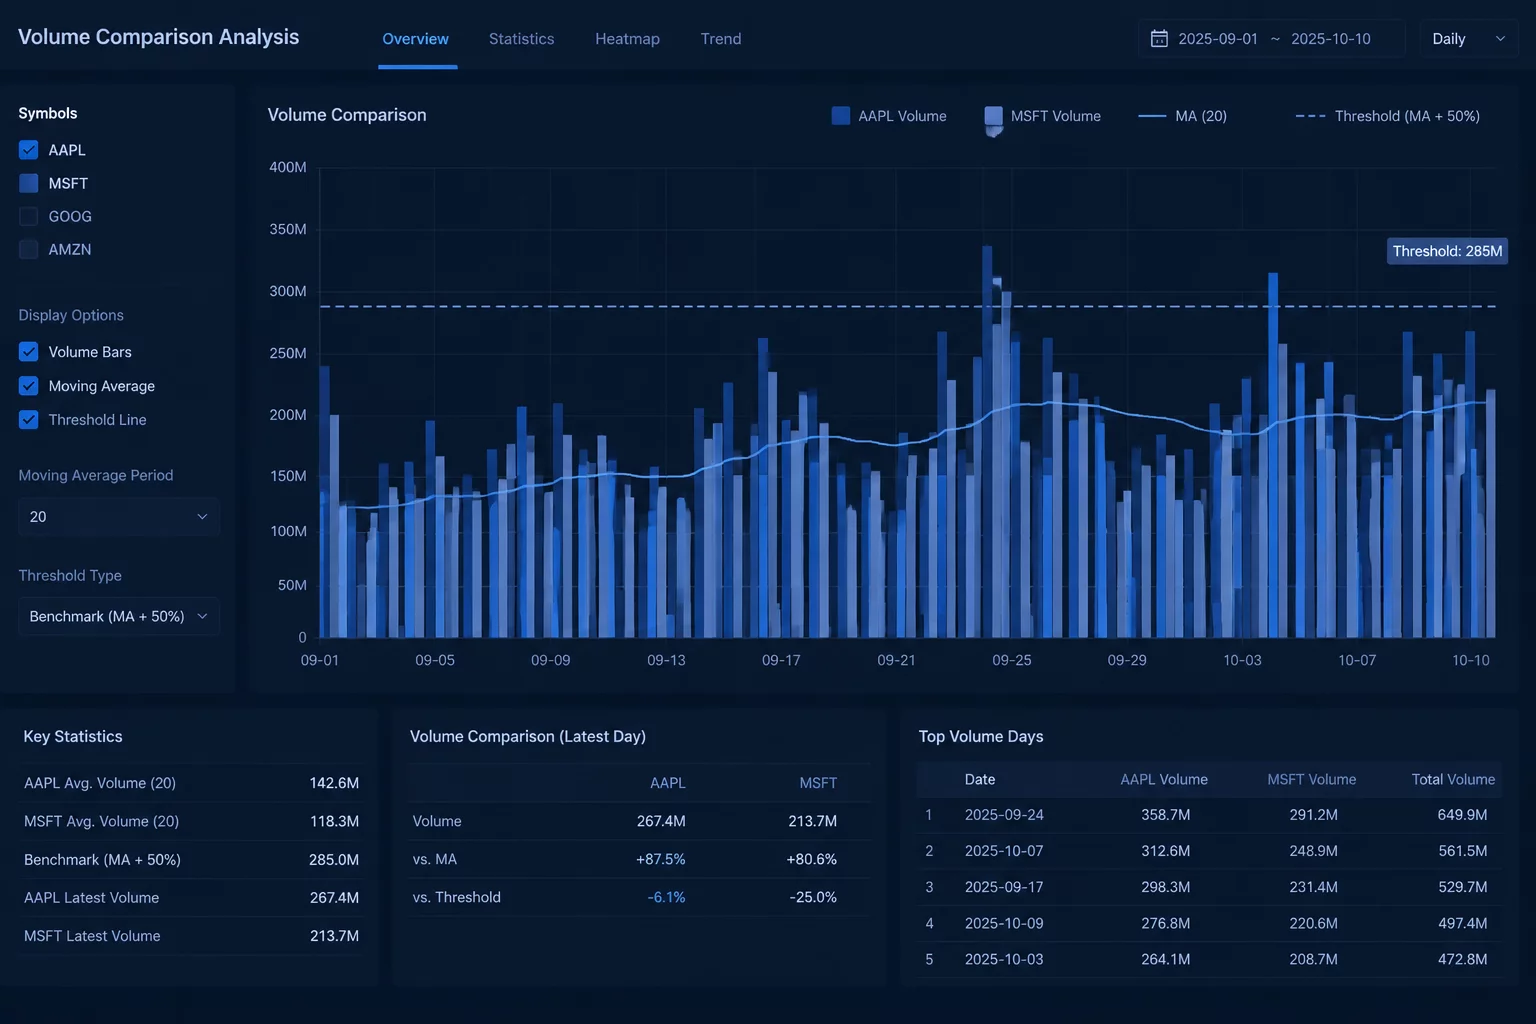
The Absolute Volume Trap in Broad Screener Queries
Screeners built with a static criteria such as "Volume greater than 5,000,000 shares" routinely fail to isolate unusual institutional interest, delivering instead a predictable list of mega-cap equities on quiet trading days.
Market capitalization and share float vary drastically across listed companies. For a conglomerate with twelve billion shares outstanding, a five-million-share session represents routine, subdued turnover well below its fifty-day baseline. Conversely, that exact same turnover occurring within a mid-tier enterprise with twenty million tradeable shares constitutes an exceptional event worthy of thorough manual review.
Setting an unadjusted share threshold creates a silent selection bias. The screener answers the unintended question "Which tickers possess enormous share structures?" rather than "Which companies experienced unusual liquidity conditions today?" Without a reference frame, raw volume figures measure instrument size rather than anomalous market behavior.
Define Baseline Denominators Before Coding Filters
Establish historical rolling median values across identical timeframes to prevent equity float discrepancies from polluting output sets.
Formulating the Relative Volume Benchmark Metric
Converting the research hypothesis into an observable criterion requires dividing current bar volume by a rolling historical benchmark. Using a 50-day or 60-day moving average or median establishes an individualized reference baseline for every ticker in the scanned universe, neutralizing disparities in share counts.
- Rolling Baseline Window
- 60-Day Daily Median
- Minimum Multiplier Ratio
- ≥ 2.5x Normal Level
- Intraday Curve Compensation
- Time-Slice Matched
- Routine Candidate Reduction
- 82% Noise Elimination
Median-based denominators deliver greater screener stability than simple arithmetic means. A single quarterly earnings gap or index rebalancing day inflates a 30-day average for weeks, dampening scanner sensitivity to subsequent genuine surges. A rolling median isolates recurring baseline behavior without being distorted by past solitary spikes.
“A trading volume surge has zero diagnostic significance until the analyst defines the quiet baseline against which the deviation is measured.”
Accounting for the U-Shaped Daily Liquidity Profile
Executing relative scans during market hours introduces another systematic trap: the intraday volume curve. Because trading activity clusters heavily around the opening bell and the market close, comparing an 10:15 AM volume snapshot against full-day benchmarks generates empty results, while comparing it against an unweighted fraction causes early morning false positives.
To eliminate this distortion, robust queries evaluate cumulative turnover against historical volume recorded up to the exact minute of calculation over preceding sessions. This ensures that a 9:45 AM scan measures how unusual current trading is for 9:45 AM, preserving query integrity throughout the session.
Manual Inspection of Relative Volume Candidate Sets
A mathematically sound relative filter produces candidate cohorts rather than actionable signals. A 400% volume surge in an illiquid instrument might stem from a single negotiated block transfer between two institutions, pre-arranged option exercises, or corporate actions rather than broad public participation.