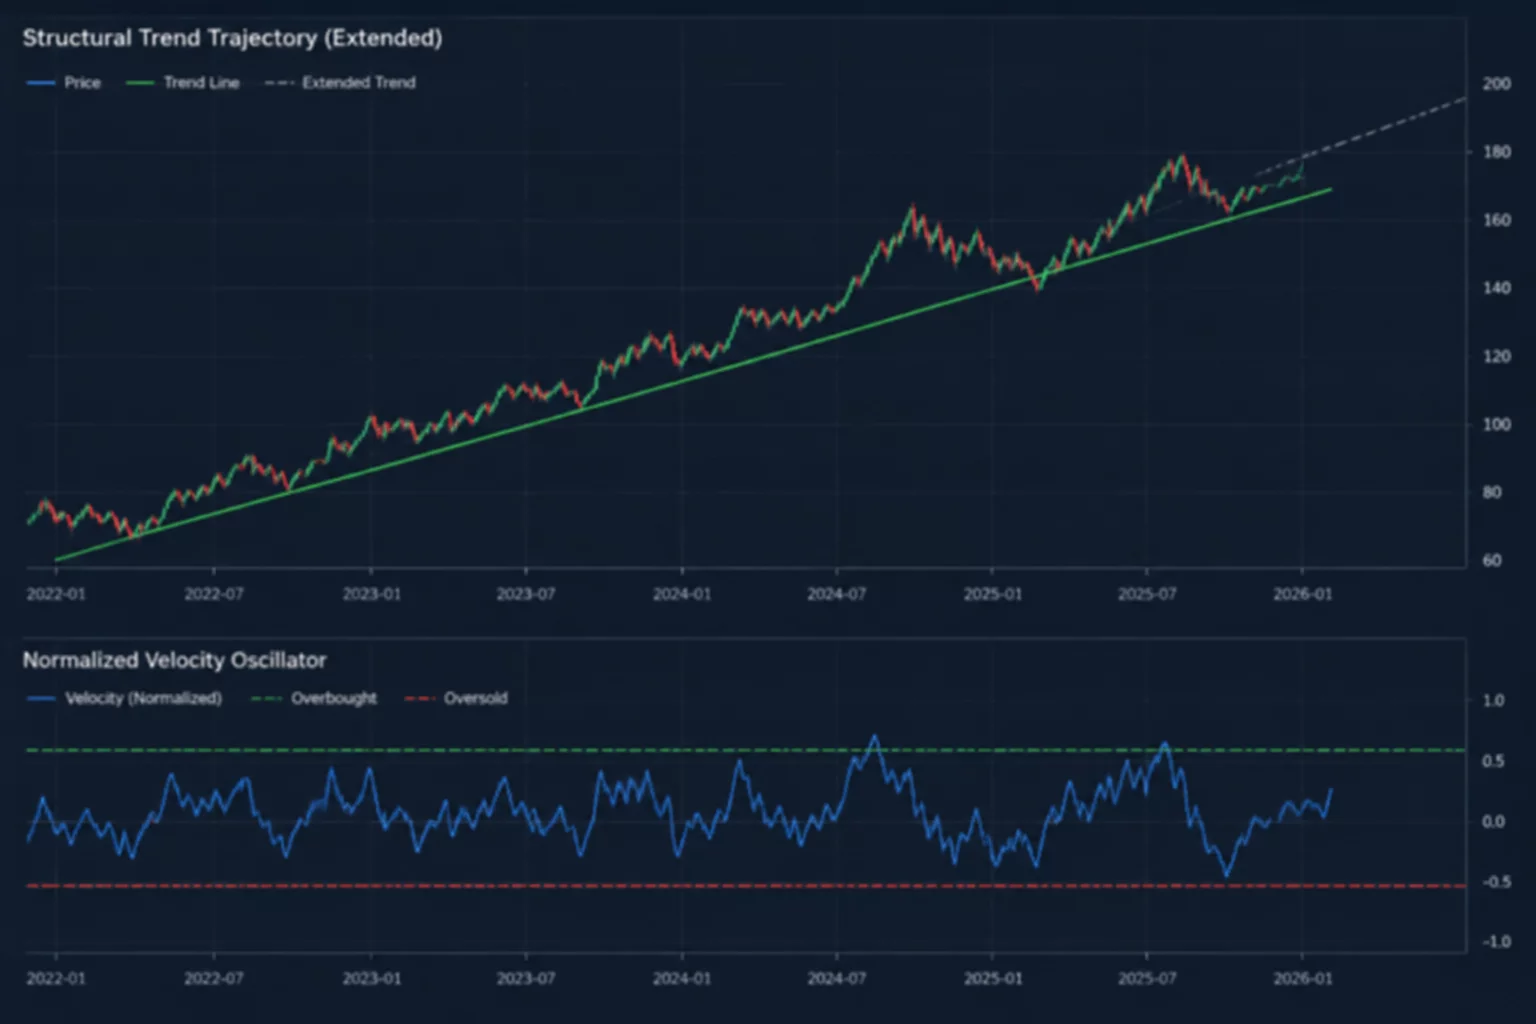
Directional Drift Versus Rate of Change
Many analysts inadvertently combine two indicators that compute nearly identical aspects of price behavior, or conversely, assume a trending instrument must also possess strong immediate momentum.
Trend filters answer a simple structural inquiry: where has the asset been moving relative to its baseline history? When an inquiry specifies a positive 50-day simple moving average slope or requires price to hold above the 200-day exponential moving average, it isolates directional persistence. It does not measure speed. An equity climbing at a steady 0.15% per day registers an unmistakable upward trend, yet its rate-of-change or standard oscillator metrics will register neutral or even declining acceleration.
Momentum filters, in sharp contrast, compute mathematical velocity across finite lookback increments. An oscillator like the 14-period Relative Strength Index or a 10-day Rate-of-Change measures how quickly prices change over that designated window. A security can stage a violent three-day counter-trend bounce within a devastating six-month markdown; in that scenario, momentum spikes into extreme overbought territory while the primary trend remains decisively downward.
Explore Multi-Condition Architecture in Screener Queries
Discover how to design complementary filter matrices that pair structural trend baselines with non-collinear momentum conditions.
Diagnosing Collinearity and Divergence in Scan Outputs
When a market scan applies both a trend condition and a momentum condition without distinguishing their mathematical objectives, the resulting candidate pool frequently shrinks or delivers contradictory profiles. Analysts who demand both a strong upward 200-day trend and an extreme short-term momentum surge inevitably capture late-stage parabolic exhaustion moves rather than early trend continuations.
- Trend Baseline
- Close > SMA(200) & SMA(50) Slope > 0
- Velocity Criterion
- ROC(10) > 8.5% Normalized
- Collinearity Index
- 0.28 (Statistically Independent)
- Candidate Reduction
- 64.2% Narrower than Single Metric
By mapping the two metrics on an orthogonal coordinate system, candidates fall into four intuitive quadrants: trending with high momentum, trending with declining momentum (consolidation), counter-trend momentum bursts, and dormant drift. Screener queries that explicitly recognize these quadrants prevent the analyst from treating every screen output as a uniform directional signal.
“Trend tells you where price has chosen to live; momentum tells you how fast the car was travelling when it crossed your radar gun.”
Structuring Complementary Filters Without Data Redundancy
Constructing a robust scan requires separating the foundational environment from the trigger catalyst. When building queries in environments such as thinkorswim Stock Hacker or custom Python backends, researchers often stack RSI, MACD, and Stochastic oscillators together. Because these three metrics share close mathematical dependencies on recent closing prices, stacking them merely duplicates the same observation while increasing computational overhead.
A superior methodological approach pairs one slow-moving structural filter with one fast-moving normalized velocity filter. For example, using the slope of a linear regression channel over 63 trading days establishes the baseline market regime. Stacking a 12-day normalized rate-of-change across volume-weighted intervals then tests whether current energy aligns with or contradicts that broader trend.
Post-Scan Manual Review & Visual Verification
A screener cannot evaluate chart context, market structure breaks, earnings calendar gaps, or index beta shifts. Once the scan isolates instruments exhibiting both positive structural drift and non-overbought momentum resumption, manual inspection becomes compulsory. The researcher checks whether the momentum pullback occurred on shrinking volume into structural support or whether a sudden headline generated an unrepeatable anomaly.