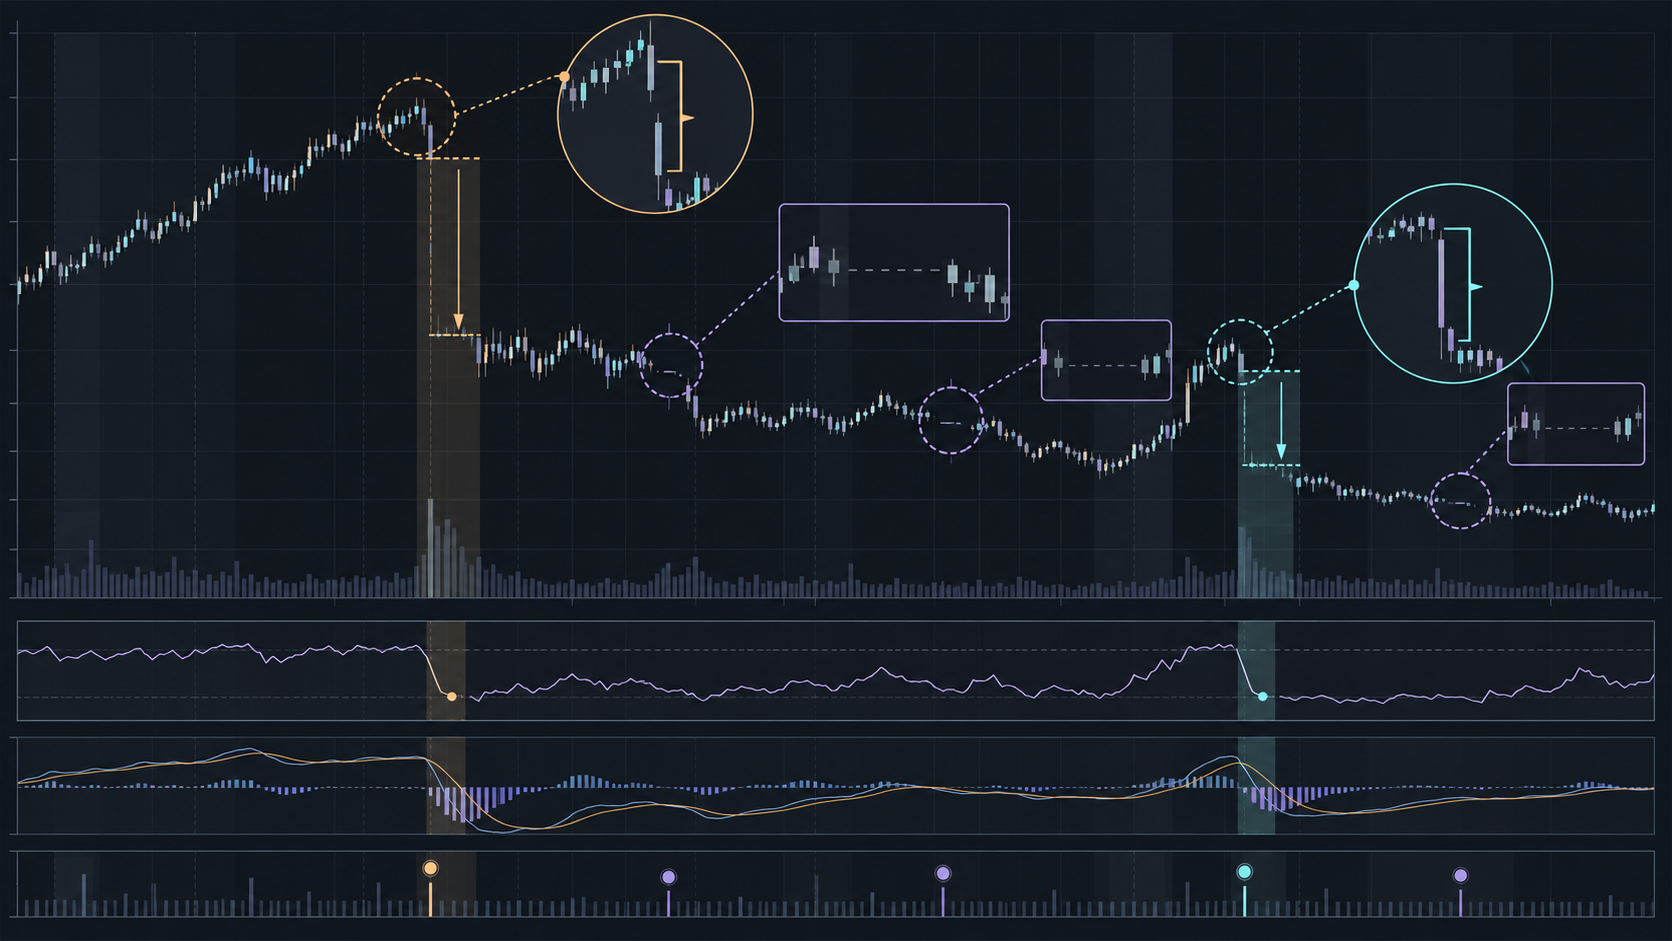
The Architecture of Phantom Breakouts and Feed Distortions
Quantitative screening filters evaluate Boolean conditions without contextual awareness, rendering them vulnerable to aberrant quotation records and feed latency.
When a systematic filter identifies an apparent 300% surge in volume paired with a new high, market practitioners often conclude an authentic institutional accumulation phase has begun. In reality, commercial data feeds frequently ingest delayed cross trades, unadjusted reverse splits, or non-cleared after-hours test prints. The scanner executes its mathematical comparisons accurately, yet the resulting record reflects a data artifact rather than market participation.
Eliminating these phantom triggers requires establishing strict manual verification checkpoints immediately following query execution. By scrutinizing the underlying tick distribution before logging candidates into research tracking sheets, analysts prevent distorted metrics from contaminating downstream backtests and observational portfolios.
Cleanse Your Scan Logic of Recurring Feed Noise
Submit an educational inquiry or review our systematic checklist guides to isolate unadjusted corporate actions and illiquid spikes.
Four Common Data Artifacts That Trigger Screener Formulas
Different data architectures produce distinct error profiles. Identifying the mathematical signature of each anomaly allows researchers to diagnose screener discrepancies rapidly during visual chart inspection:
- Unadjusted Reverse Splits
- Artificial 10x-50x Price Jump
- Delayed Form T Tape Prints
- Off-Market Volume Spike
- Illiquid Bid-Ask Spreads
- Ghost Volatility Expansion
- Recycled Ticker Symbols
- Corrupted Historical Base
Unadjusted reverse splits generate the most extreme false positives: when a micro-cap executes a 1-for-20 reverse consolidation, feeds lacking prompt historical adjustments suddenly reflect a massive multiple-hundred percent advance. The ticker surges into breakout filters while underlying business fundamentals remain distressed. Similarly, Form T late prints consolidate off-exchange volume hours after the bell, triggering end-of-day relative volume alerts without normal intraday participation.
“A scanner does not observe economic intent; it executes a mathematical comparison on whatever number sits in the data column. When the data column is flawed, the scan outputs an illusion.”
A Practical Ten-Second Visual Verification Checklist
Manual inspection should be swift, systematic, and decisive. Rather than calculating complex technical overlays, an analyst should inspect the fundamental bar structure of each scan hit across a ten-second assessment protocol.
Look specifically for horizontal dash bars, missing intraday candles, or wide price wicks driven by single-share prints on illiquid shares. Open an intraday volume chart to determine whether the reported volume occurred continuously or materialized as an isolated monolithic block transaction at 16:15 ET.
Fortifying Filter Criteria Against Upstream Data Failure
While manual review remains the definitive gatekeeper, query logic can be calibrated to intercept artifacts upstream. Incorporating minimum trade-count criteria, average dollar volume thresholds rather than raw share counts, and exchange membership parameters eliminates the vast majority of corrupt candidates before manual review begins.