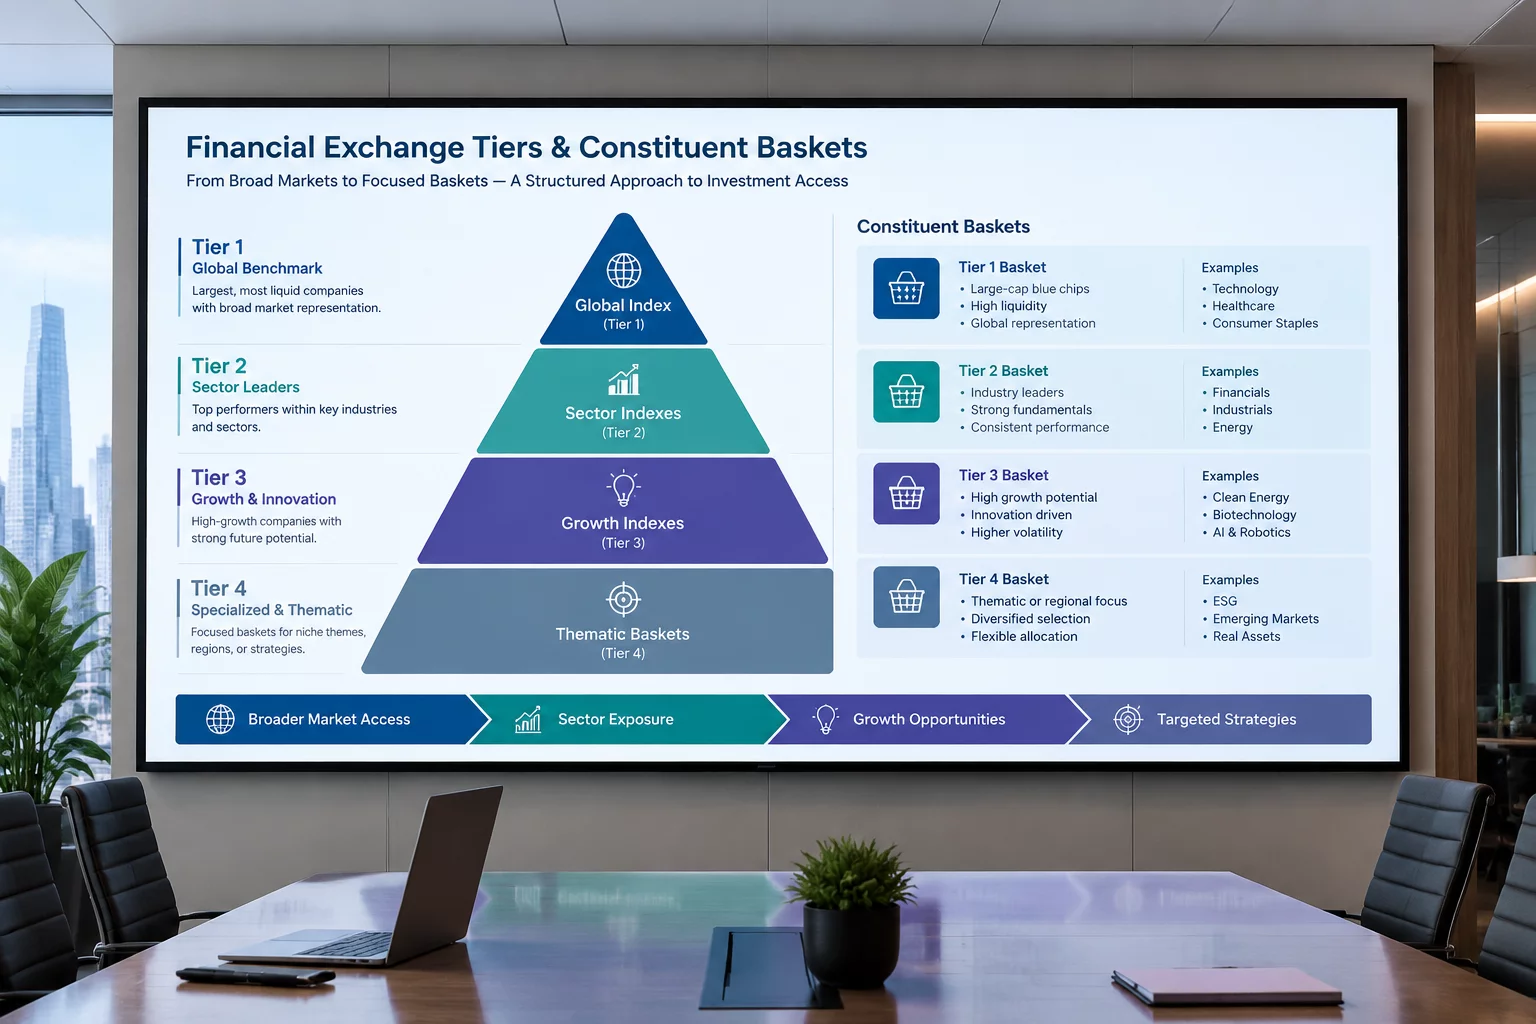
Why Listing Tiers and Benchmark Baskets Are Not Interchangeable
Filtering by exchange listing isolates regulatory oversight and reporting cadences, whereas index membership enforces capitalization constraints and governance liquidity standards.
A frequent misconception among quantitative researchers involves treating exchange classifications as proxies for index membership. Querying all symbols listed on the Nasdaq Composite yields over 3,000 tickers spanning micro-caps, foreign ADRs, warrants, and pre-revenue biotech companies. In contrast, evaluating the Nasdaq-100 isolates exactly one hundred non-financial domestic leaders governed by strict quarterly rebalancing formulas. When screener queries conflate these boundaries, the resultant distribution shifts drastically toward thinly traded outliers.
Primary exchanges such as the NYSE and Nasdaq establish minimal listing qualifications regarding shareholder equity and continuous quote obligations. Benchmark index committees, however, introduce qualitative profit requirements, public float thresholds, and sector balancing rules. A scanner configured to evaluate broad exchange symbols inherits extreme variance across bid-ask spreads, corporate structure types, and tick sizes. Isolating constituents from established benchmarks enforces institutional liquidity minimums before any mathematical formula executes.
Need systematic guidance on universe boundary logic?
Learn how to formulate baseline listing rules and avoid contaminated scanner output sets in our workbook sessions.
The Reconstitution Lag and Survivorship Contamination
Benchmark indices undergo scheduled reconstitutions, typically executed on an annual or quarterly schedule. During these rebalancing windows, underperforming firms facing falling market valuations drop out, while emerging high-growth businesses take their places. Screener engines maintaining static ticker universes invariably introduce historical reconstitution lag. Evaluating an index basket through outdated ticker maps measures stale survivors rather than the true historical cohort active at that precise point in time.
- Broad Exchange Scope
- ~4,800 Active US Tickers
- Major Benchmark Core
- S&P 500 / Russell 1000
- Annual Turnover Rate
- 2.4% - 6.8% Average
- Delisting Frequency
- ~120 - 180 Tickers / Year
Furthermore, secondary exchange tiers like OTC Markets, pink sheets, and Bulletin Board venues introduce severe microstructural frictions. Many screener engines default to broad equity scopes, silently injecting unverified penny stocks with anomalous wide spreads and stale transaction prints. An apparent breakout pattern detected on an illiquid OTC instrument frequently represents a recording artifact rather than genuine price discovery. Restricting screener queries to primary National Market System (NMS) tiers eliminates these false positives at the root.
“When an analyst assumes index membership implies stationary parameters, the scanner quietly measures yesterday's winners while filtering out the actual structural drift of the modern market.”
Practical Framework for Defining Universe Segmentation
Translating a market inquiry into an operational screener demands a disciplined two-stage hierarchy. First, construct the universe boundaries based on primary regulatory listing and minimum institutional tradability metrics. Second, apply technical and fundamental criteria only to instruments passing these gateway thresholds. By separating boundary conditions from behavioral formulas, researchers preserve query clarity and prevent mathematical metric distortion.
In tools like thinkorswim Stock Hacker, the universe selector dictates whether a query evaluates all equities, specific index baskets, or custom user watchlists. Selecting a broad composite when the underlying research question targets institutional momentum contaminates the output with micro-cap volatility spikes. Conversely, scanning solely within mega-cap benchmarks when researching early-stage growth dynamics artificially blinds the system to mid-tier breakthroughs. Aligning universe scope with research premise is the single most critical diagnostic check.
Cross-Exchange Normalization and Quality Control
Different trading venues operate under distinct auction protocols, opening auction imbalances, and tick size regimes. The New York Stock Exchange utilizes designated market makers (DMMs) who balance closing auctions, while Nasdaq employs pure electronic cross algorithms. When a scan combines multiple venues into a single result set, relative metrics such as opening volume surges or closing tick changes behave differently depending on the exchange of origin. Normalizing volume metrics against 30-day trailing exchange-specific averages ensures fair comparison across disparate venues.